
Stop Drowning in Data and Start Visualizing Student Success.
You have the spreadsheets full of quiz scores, attendance logs, and participation points. But looking at them feels like staring at a wall of text. It’s overwhelming, and finding actual classroom insights is nearly impossible.
This kit turns your raw student data “ingredients” into a beautifully plated, actionable dashboard with just a few clicks.
The Problem: Data Overwhelm
Let’s face it: Standard filtering is clunky. If you want to compare 1st and 2nd period scores simultaneously, or see how a specific student performed across different quiz topics, a basic spreadsheet requires tedious manual sorting. The information is there, but it’s hidden.
The Solution: The Interactive Dashboard
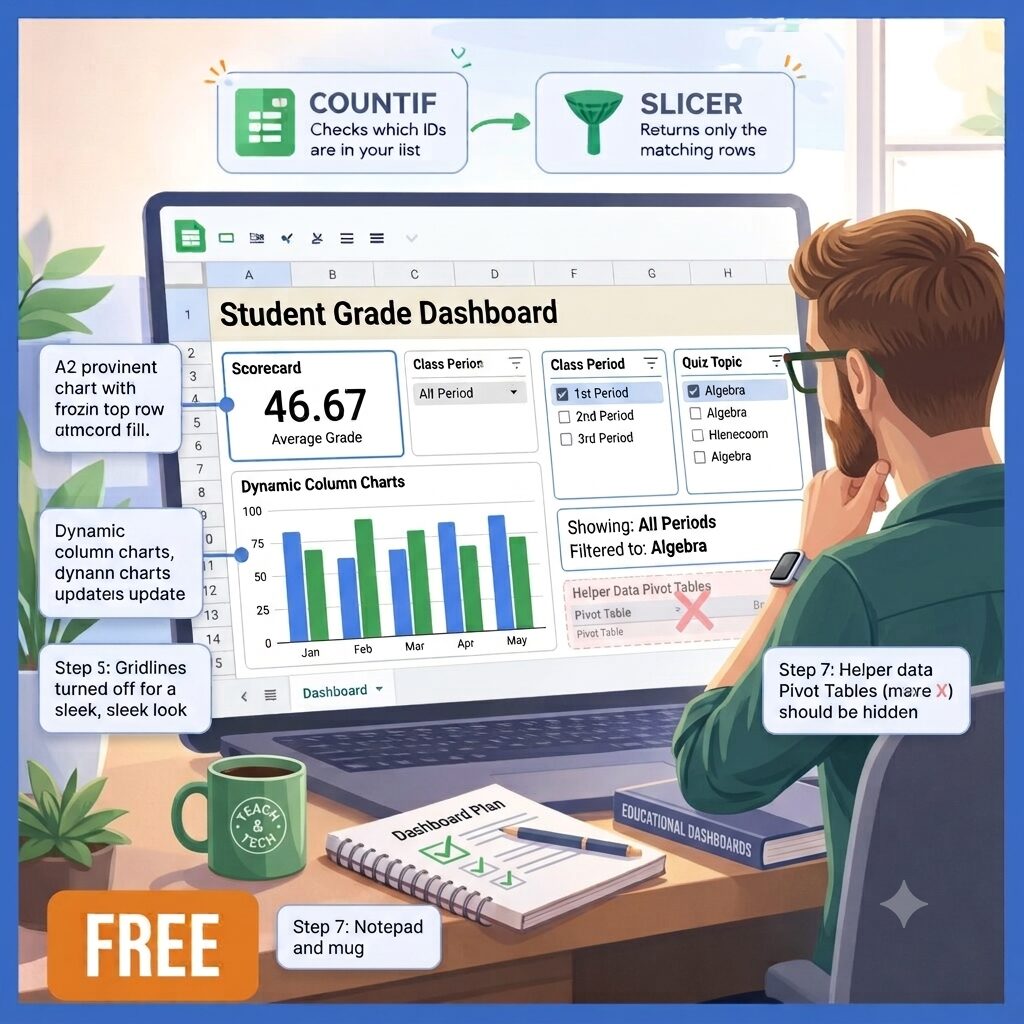
This download provides the template and step-by-step guidance to build the exact dynamic visual tool shown in the image. This isn’t just a static spreadsheet; it’s a “cockpit” for your classroom.
Key Features of Your New Dashboard:
-
Interactive Slicers: Forget complex formulas. These visual buttons let you toggle filters—like Class Period or Quiz Topic—instantly. Watch your charts update dynamically with a single click.
-
The Big Number Scorecard: Instantly view high-level metrics, such as the overall average grade, based only on your active filters.
-
Dynamic Trend Charts: A visual column chart that automatically adapts as you slice and dice the data. See growth and identify bottlenecks at a glance.
-
Slicer Decoder Labels: We’ve solved the “active filter mystery.” Clear, dynamic labels tell you (and anyone you share it with) exactly what filters are currently applied.
-
A Professional, App-Like Feel: We guide you through formatting tricks to hide gridlines, helper tables, and unused rows, leaving you with a clean, professional tool that looks like a custom-built web application.
What’s Included:
-
The “Data” Tab Template: A pre-formatted structure (20 student rows) to organize Student Name, Class Period, Quiz Topic, Grade, and Study Time.
-
The Step-by-Step Build Guide: A detailed, downloadable PDF recipe that walks you through every crucial feature:
-
Creating Pivot Table “helper tables.“
-
Connecting interactive Slicers.
-
Building the Scorecard using the powerful
=SUBTOTALfunction. -
Plating the dynamic graph.
-
Final “chef’s tips” for formatting and professional cleanup.
-
Don’t settle for static lists. Turn your messy logs into meaningful growth charts and start making data-driven decisions that impact student outcomes.

Reviews
There are no reviews yet.